Pages

Thursday, October 1, 2026

Tags in Safari History db


I noticed an interesting feature in Safari's History database today. Safari tries to interpret every page you visit into a few words, represented as a Tag. But importantly, not all pages are tagged. The exact mechanism of how it arrives at a tag name is also uncertain but it piqued my interest as a case I was recently working on had some curious Tag entries in it!

This does not seem to be a new feature, as I've seen this in databases going back to at least 2021. 

Artifact location

In the Safari History db located at ~/Library/Safari/History.db

There are 2 tables of interest here: history_tags and history_items_to_tags. As the name suggests, the latter has info to join the tags to the actual history_items table entries while the former (history_tags) has the tag details.

Figure 1 - Tables holding tag data

This is what my own Safari history_tags table look like: 

Figure 2 - history_tags table content

The modification_timestamp represents the last time a page (assigned that tag) was visited. The value is of type NSDate (aka Cocoa timestamp) having epoch of 2001-01-01.

The Tag name is in the title column. Now notice that identifier column that always starts with a 'Q'. This is because Safari links every tag to a wikidata item (as shown below).

Figure 3 - The identifier field

Quick query to pull out this information along with the full history data from the database:
SELECT history_visits.title, url, 
  datetime(visit_time + 978307200, 'unixepoch') as visit_time, 
  history_tags.title as tag_title,  
  history_tags.identifier as tag_identifier, 
  datetime(history_tags.modification_timestamp  + 978307200, 'unixepoch') as tag_mod_date
FROM history_visits 
  LEFT JOIN history_items on history_visits.history_item = history_items.id
  LEFT JOIN history_items_to_tags ON history_items_to_tags.history_item=history_items.id
  LEFT JOIN history_tags on  history_items_to_tags.tag_id=history_tags.id
ORDER BY visit_time
Figure 4 - Output showing full history with tag details


Remember, not all pages have tags, and in the ones that do, the tags may not always be accurate. In my database about 98% of the time, the tag represented something related to the page (not always the central theme but definitely related). Below is an example of what a page was tagged as, but its a completely different story, both are related to planes though.

Figure 5 - Sample data from history


Forensic fun facts and usage

While in my own experiments, clearing the Safari history does seem to remove the corresponding entries from this table as well, I do also have some test systems where the history_tags table has old data having thousands of entries, with several having an item_count of 0 (as can be seen below). 

Figure 6 - history_tags with no associated history items due to deletion

While the above may not be the smoking gun you are looking for, it can provide some good insight of what themes the end user was browsing and when. 

On the case that inspired deeper inspection of this table, the tag was "APT" (Q230724), which got me excited only to find out that it refers to Advanced Package Tool, as in Homebrew or Linux 'apt'. But the website we were interested in was a phishing site impersonating the real Homebrew site, and it was properly tagged as APT, while the real Homebrew site got no tags!

mac_apt has been updated to add parsing of tags. Tags without item counts are shown as type "TAGGED". 

Figure 7 - mac_apt Safari output


Wednesday, January 22, 2025

New Wifi database from Apple intelligence


Apple Intelligence, while officially released only in 2024 (a few months ago) for macOS 15.1 (Sequoia) has been around for over a year in beta on most macOS and iOS systems. Its only available for Apple's M1 processor and later, and for macOS 15.1 (and higher). However on all macs at least macOS 14, you should have the folder corresponding to it here:

/Users/<USER>/Library/IntelligencePlatform

So even though my system is not supported, it still has the above folder. I didn't find anything too interesting in any of these databases from a forensics perspective (except for the wifi data!). But perhaps that may also be because I am not running a supported device (I'm not on Apple Silicon yet). 

The Wifi data resides in the database located here under table wifiContextEvents:

/Users/<USER>/Desktop/IntelligencePlatform/Artifacts/internal/views.db


The data is quite self explanatory, every time a Wifi network is connected to, or disconnected from, an event is created here. So far I've seen this mostly include events for the current month but sometimes these go back a few months too. It is periodically emptied.

The timestamp is just a Cocoa (NSDate) type, can easily be converted back to human readable form.


Artifact Parsers


Sunday, January 12, 2025

mac_apt update to BTM processing

This post highlights improvements to the AUTOSTART plugin in mac_apt.

Since macOS 13 (Ventura), Login items and Background tasks are managed and tracked via .BTM files. This is located at the path:

/private/var/db/com.apple.backgroundtaskmanagement/BackgroundItems-v<xx>.btm

where <xx> is the version number, currently 13 on macOS 15.2

Much of this information (but not all!) is visible to the end user via the Login items & Extensions page under System Settings as shown below.

Figure 1 - Login items & Extensions from System Settings

mac_apt's AUTOSTART plugin already processed BTM files, however this is now significantly improved. Previously BTM specific parameters were not being parsed and developer entries were also included (which are not autostart) which made them difficult to read and interpret, also missing some key information. 

BTM files are NSKeyedArchives which when deserialised contain dictionaries of items (login and background tasks) per user. 

Figure 2 - Snippet of single item from .BTM file

How these are interpreted and transformed into the nice GUI view seen above is dependant mostly on the parameters 'type' and 'disposition'. The following values have been observed for these fields:

DispositionValues = {
0x01: 'Enabled',
0x02: 'Allowed',
0x04: 'Hidden',
0x08: 'Notified'
}

TypeValues = {
0x00001: 'user item',
0x00002: 'app',
0x00004: 'login item',
0x00008: 'agent',
0x00010: 'daemon',
0x00020: 'developer',
0x00040: 'spotlight',
0x00800: 'quicklook',
0x80000: 'curated',
0x10000: 'legacy'
}

The 'type' value indicates if this item is an agent, daemon, app, user defined item or a spotlight or quicklook extension. 

When a user toggles the option to OFF for an item in the "Allow in the Background" setting, this will clear the 'Allowed' bit in the Disposition flag thereby indicating 'Not Allowed'. 

mac_apt now reads, interprets and shows the BTM parameters for disposition, type, container, developer and executableModifiedDate. The following output snippet filtered for "Not Allowed" will show the same output as that shown in System settings GUI. As seen in Fig 1 above (and Fig 4 below), 2 Citrix items are toggled to OFF, resulting in 6 apps belonging to these items being in the 'Not Allowed' group.


Figure 3 - Snippet of AUTORUNS output from mac_apt, filtered on BackgroundTask items and 'Not Allowed' disposition

Figure 4 - Disabled items from System Settings

This greatly simplifies the review of background applications. If the app itself disables a startup item, then the 'Enabled' flag is off, this will be missing from the BTM_Disposition column. mac_apt will populate the Disabled column with the value '1' to also indicate this. 

Also added is an 'AppArguments' column, which should populate the full command line arguments from all processed files (BTM and plists).

Be aware that mac_apt will process all encountered .btm files, so you may see repeated data as there are likely older .btm files, vestigial artefacts from previous macOS versions. On my test system, I've got BackgroundItems-v9.btm and BackgroundItems-v13.btm. This may be useful from a forensics perspective to look at the autostarts from that point in time. You will have to filter on the 'Source' column in the output if you wish to see only current data. 

Sunday, August 4, 2024

NSKeyedArchive Deserializer update

A long time ago I wrote some code to make NSKeyedArchives (NSKA) human readable, basically de-serializing the data. It was then converted to a library for use in other projects like iLeapp and mac_apt. I revisited this last week and found and fixed a minor bug. While at it, I also added an extra capability, mostly for the folks who don't prefer to touch code. 

Previously, this library only worked with NSKA files. If a file was a normal plist, it would return an exception complaining about not being able to find the '$archiver' element in the plist. But what if you had files that were normal plists (not serialised), but had nested NSKA plists as data blobs within. There are actually quite a few on ios/macOS. To make them human-readable, you would have to write code to extract the blobs and run them through the library. The previous code also did not handle recursive deserializing even within NSKA archives. 

Now with the latest update (version 1.4.0), there is an extra parameter in the deserialize_plist(...) and deserialize_plist_from_string(...) functions to unlock this functionality and also performs full recursive deserializing of all nested blobs. 

def deserialize_plist(path_or_file, full_recurse_convert_nska=False)

By default, the value is False emulating the old behaviour. However, when set to True, this will no longer return an exception for non-NSKA (unserialized or normal) plists and will always return a plist. If there was a data (binary blob) element anywhere in the tree that had a value containing a valid header for an NSKA plist, that will now be replaced with a tree branch representing the deserialized version of the NSKA data.

Figure 1 - NSKA plist deserialized with old code vs new


If you are using nska_deserialize dependancy in any project, update to the latest:

pip3 install nska_deserialize --upgrade


The old compiled exe has been updated (with the flag set to True). It is also very conventient to use with drag and drop as shown here.

Friday, November 4, 2022

Reading OneDrive Logs Part 2

In the last OneDrive blog post, I outlined how the ODL file format is structured. A working version of an ODL parser was also created to read these files. One key detail was how personal file/folder, location or credential identifying strings were obfuscated with the original values stored in the ObfuscationStringMap.txt file. 

However some time in April 2022, Microsoft decided to change the way the obfuscation worked and the parser no longer worked (the unobfuscation part). 

What changed?

OneDrive now appeared to encrypt the data and the ObfuscationStringMap.txt is no longer used. The file may still exist on older installations, but newer ones include a different file.

Figure 1 - Contents of  \AppData\Local\Microsoft\OneDrive\logs\Business1 folder

As seen in Figure 1 above, there is a new file called general.keystore. This file's format is JSON that can be easily read and apparently holds the key to decrypt the encrypted content as a base64 encoded string. 

Figure 2 - Sample general.keystore contents


Time for some Reverse Engineering

With a little bit of digging around with IDA Pro on the LoggingPlatform.dll file from OneDrive, we can see the BCrypt Windows APIs being used in this file. Note, this is not the bcrypt hash algorithm which bears the same name!

Figure 3 - BCrypt* Imports in LoggingPlatform.dll

Jumping to where these functions are used, it is quickly apparent that the encryption used is AES in CBC (Cipher Block Chaining) mode with a key size of 128 bits. 


Figure 4 - IDA Pro Disassembly

In the above snippet, we can see the call to BCryptAlgorithmProvider and then if successful, a call to BCryptSetProperty function which has the following syntax:

NTSTATUS BCryptSetProperty(
  [in, out] BCRYPT_HANDLE hObject,
  [in]      LPCWSTR       pszProperty,
  [in]      PUCHAR        pbInput,
  [in]      ULONG         cbInput,
  [in]      ULONG         dwFlags
);

Without delving into too many boring assembly details, I'll skip to the relevant parts...

For each string to be encrypted, OneDrive initialises a new encryption object with the key that is stored in the general.keystore file, then encrypts the string and disposes of the encryption object. The encrypted blob is then base64 encoded and written out to the log the obfuscated string. There are a few other quirks along the way, such as replacement of the characters  / and  + with _  and - respectively, as the former can appear in base64 text but are also used in URLs to make it parseable later.


Why the change?

In the previous iteration of ODL (when the ObfuscationStringMap was used), there were instances where the same key (3 word combination) was often repeated in the file making it difficult or impossible to know which value to use as its replacement to get the original string.

Using encryption in place and not using a lookup table does appear to be a more robust scheme which eliminates the above issue. It does use some more disk space as the encrypted blob will always be a multiple of 16 bytes (128 bits) as this is block based encryption. In other words, it's inefficient for small text (less than 10 bytes). 


Updated code

The python ODL parser has been updated to accomodate this new format, and works with both the old and new versions. It is available here.

Sunday, February 13, 2022

Reading OneDrive Logs

Due to the popularity of OneDrive, it has become an important source of evidence in forensics. Last week, Brian Maloney posted about his research on reconstructing the folder tree from the usercid.dat files, and also provided a script to do so. In this brief post, we explore the format of OneDrive Logs, and provide a tool to parse them. In subsequent posts, I will showcase use case scenarios. 

Where to find them?

OneDrive logs have the extension .odl and are found in the user's profile folder at the following locations:

On Windows - 

C:\Users\<USER>\AppData\Local\Microsoft\OneDrive\logs\

On macOS - 

/Users/<USER>/Library/Logs/OneDrive/

At these locations, there are usually 3 folders - Common, Business1 and Personal, each containing logs. As the name suggests Business1 is the OneDrive for Business version. 

Figure 1 - Contents of Business1 folder

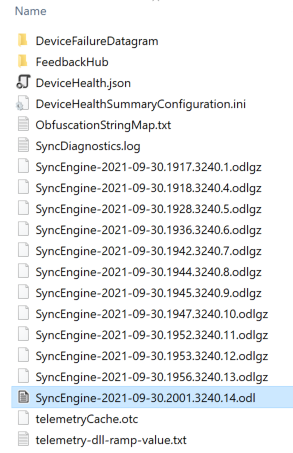
The .odl file is the currently active log, while the .odlgz files are older logs that have been compressed. Depending on which folder (and OS) you are in, you may also see .odlsent and .aodl files, which have a similar format.

What is in there?

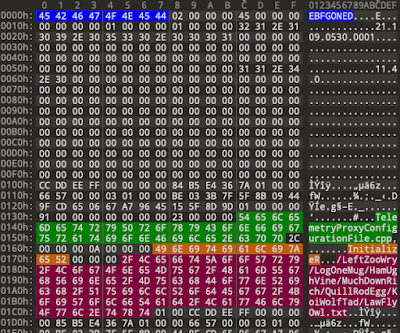
These are binary files, and cannot be directly viewed in a text editor. Here is what a .odl file looks like in a hex editor.

Figure 2 - .odl file in a hex editor

It is a typical binary file format with a 256 byte header and data blocks that follow. Upon first inspection, it seems to be a log of all important function calls made by the program. Having this low level run log can be useful in certain scenarios where you don't have other logging and need to prove upload/download or synchronisation of files/folders or even a discovery of items which no longer exist on disk/cloud. 

You do notice some funny looking strings (highlighted in red). More on that later.. 

The Format

With a bit of reverse engineering, the header format is worked out as follows:

struct {
    char     signature[8]; // EBFGONED
    uint32   unk_version;  // value seen = 2
    uint32   unknown2;
    uint64   unknown3;     // value seen = 0
    uint32   unknown4;     // value seen = 1
    char     one_drive_version[0x40];
    char     os_version[0x40];
    byte     reserved[0x64];
} Odl_header;

The structures for the data blocks are as follows:

struct {
    uint64     signature; // CCDDEEFF 0000000
    uint64     timestamp; // Unix Millisecond time
    uint32     unk1;
    uint32     unk2;
    byte       unk3_guid[16];
    uint32     unk4;
    uint32     unk5;  // mostly 1
    uint32     data_len;
    uint32     unk6;  // mostly 0
    byte       data[data_len];
} Data_block;

struct {
    uint32    code_file_name_len;
    char      code_file_name[code_file_name_len];
    uint32    unknown;
    uint32    code_function_name_len;
    char      code_function_name[code_function_name_len];
    byte      parameters[];
} Data;

In case of .odlgz files, the Odl_header is the same, followed by a single gzip compressed blob. The blob can be uncompressed to parse the Data_block structures.

Now, we can try to interpret the data. Leaving aside the few unknowns, the data block mainly consists of a timestamp (when event occurred), the function name that was called, the code file that function resides in and the parameters passed to the function. The parameters can be of various types like int, char, float, etc.. and that part hasn't been fully reverse engineered yet, but simply extracting the strings gives us a lot of good information. However the strings are obfuscated!

Un-obfuscating the strings

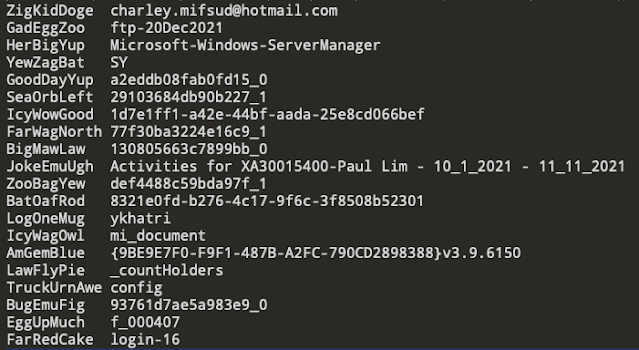
Since Microsoft uploads these logs to their servers for telemetry and debugging, they obfuscate anything that is part of a file/folder name or url string or username. However file extensions are not obfuscated. The ways this works is that the data identified to obfuscate is replaced by a word which is stored in a dictionary. The dictionary is available as the file ObfuscationStringMap.txt, usually in the same folder as the .odl files. To un-obfuscate, one simple needs to find and replace the strings with their original versions. 

Figure 3 - Snipped of ObfuscationStringMap.txt

This is a tab separated file, stored as either UTF-8 or UTF-16LE depending on whether you are running macOS or Windows. 

Now, referring back to the original funny looking string in Figure 2 - 
/LeftZooWry/LogOneMug/HamUghVine/MuchDownRich/QuillRodEgg/KoiWolfTad/LawFlyOwl.txt
  .. after un-obfuscating becomes ..
/Users/ykhatri/Library/Logs/OneDrive/Business1/telemetry-dll-ramp-value.txt

It is important to note that since extensions are not obfuscated, they can still provide valuable intel even if some or all of the parts in the path cannot be decoded.

Now this process seems easy, however not all obfuscated strings are file/folder names or parts of paths/urls. Some are multi line strings. Another problem is that the words (or keys to the dictionary) are reused! So you might see the same key several times in the ObfuscationStringMap. The thing to remember is that new entries get added at the top in this file, not at the bottom, so when reading a file, the first occurrence of a key should be the latest one.  Also sometimes, the key is not found, as it's cleaned out after a period of time. Also there is no way to tell if an entry in the dictionary is stale or valid for a specific log file being parsed. All of this just means that the decoded strings need to be taken with a grain of salt. 

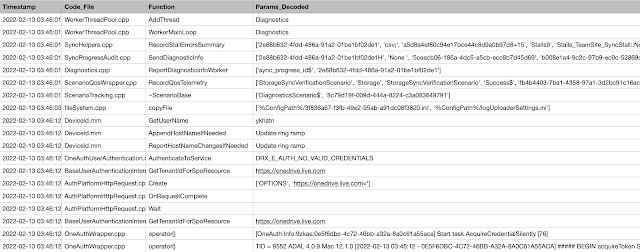
Based on the above, a python script to parse the ODL logs is available here. A snippet of the output produced by the script is shown below.

Figure 4 - output snippet


In a subsequent post, we'll go through the items of interest in these logs like Account linking/unlinking, uploads, downloads, file info, etc.. 

Saturday, January 9, 2021

Gboard has some interesting data..

Gboard - the Google Keyboard, is the default keyboard on Pixel devices, and overall has been installed over a billion times according to the Play Store.

Although not the default on most non-Google brands, it is a popular app installed by foreign language users because of its good support and convenience of use particularly with dozens of Asian and Indian languages.

As a keyboard app, it monitors and analyzes your keystrokes, offering suggestions and corrections for spelling and grammar, sentence completion and even emoji suggestions. 

Now for the interesting part. Since the last few versions, it also retains a lot of data (ie, user keystrokes!) in its cache. This is at least seen from the version from Jan 2020 (v 8.3.x). From a DFIR perspective, that is GOLD. For a forensic examiner, this can possibly show you data that was typed by the user on an app that is now deleted, or show messages typed that were then deleted, or messages from apps that have the disappearing message feature turned on! Or data entered into fields on web pages/online apps (that wouldn't be stored locally at all). Also for some apps that don't track when a particular item was created/modified, this could be useful.

Note - The Signal app wasn't specifically tested to see if data from that app is retained, but based on what we can see here, it seems likely those messages would end up here too. All testing was on a Pixel 3 running latest Android 11 using the default keyboard, and default settings. This was also verified on other earlier taken images. Josh Hickman's Android 10 Pixel 3 image was also used, and Josh was able to verify that Telegram and WhatsApp sent messages were present here. The specific versions of Gboard databases studied were:

  • 8.3.6.250752527 (on Android 10)
  • 8.8.10.277552084 (on Android 10)
  • 10.0.02.338070508 (on Android 11)

Location

Gboard's app data (sandbox) folder is located here:

/data/data/com.google.android.inputmethod.latin/databases/

Here you might see a number of databases that start with trainingcache*. These are the files that contain the caches.

Figure 1 - Contents of Gboard's databases folder (v 10.0.02.338070508)

In different versions of the app, the database formats and names have changed a bit. Of these, useful data can be found in trainingcache2.db, trainingcache3.db and trainingcachev2.db. Let's examine some of them now.

trainingcache2.db (v 10.0.02.338070508)

The table training_input_events_table contains information about the application in focus, its field name (where input was sent), the timestamp of event and a protobuf BLOB stored in _payload field, as shown in screenshot below.

Figure 2 - training_input_events_table (not all columns shown)

The highlighted entry above is from an app that was since deleted. The _payload BLOB is decoded in screenshot below, highlighting the text typed by the user in the Email input field. The protobuf has also has all of the data included in the other columns in the table.

Figure 3 - Decoded Protobuf from _payload column

In most instances however, the protobuf looks like this - see screenshot below, where input needs to be put back together as shown.. Here you can see the words the user typed as well as suggestions offered by the app. Suggestions can be for spelling, grammar, or contact names, or something else.
Figure 4 - Decoded protobuf - reconstructing user input

Above, you can see the words typed and suggestions offered. On an Android device, the suggestions appear as shown below while typing.

Figure 5 - Android keyboard highlighting suggested words

trainingcache3.db (v 10.0.02.338070508)

In version 8.x, this same database is named trainingcache2.db, and follows the same exact format. The table s_table looks similar to the training_input_events_table seen earlier. However, the _payload field does not store the keystokes here.

Figure 6 - s_table

Figure 7 - _payload protobuf decoded from s_table

Keystroke data is stored in the table tf_table. Here, most entries are a single key press, and to read this, it again needs to be put back together as shown below.

Figure 8 - tf_table entries

All keystrokes from the same session have the same f1 value (a timestamp like field but not used as a timestamp). The order of the keys pressed is stored in f4. Assuming they are all in order, we can run a short query to concatenate the f3 column values for easy reading (shown below). This isn't perfect, as group_concat() doesn't guarantee order of concatenation, but it seems to work for now!

Figure 9 - Reading keystroke sessions from tf_table

We can combine (join) this data with the one from s_table to recreate the same data as we got from training_input_events_table earlier. 

Figure 10 - joined tables

In the screenshot shown above, you can even see data being typed into a google doc, not saved locally. Only a snippet is shown above, but if you want to see the full parsed data, get Josh's Android image(s), and the latest version of ALEAPP (code), which now parses this out. Below is a preview (from a different image my students might recognize).

Figure 11 - ALEAPP output showing trainingcache parsed output


Cached keystroke data can also be seen and reconstructed from trainingcachev2.db, whose format is a bit different (not discussed here). Nothing of significance was found in trainingcache4 or the other databases. 

Observations

As expected, keystrokes from password fields are not stored or tracked.

In data reconstructed from tf_table, you can see all the spelling mistakes a user made while typing! Any corrections made in the middle of a word/sentence will be seen at the end (because we are getting the raw keystokes in order of keys pressed). Hence it might be difficult to read some input. Also, if a user types something into a field, then deletes a word(s), and retypes, you won't see the final edited (clean) version, as backspaces (delete) are not tracked. You can see some of this in the output above (figure 9).

The caches are periodically deleted (and likely size limited too), and so you shouldn't expect to find all user typed data here.