Pages

Friday, November 4, 2022

Reading OneDrive Logs Part 2

In the last OneDrive blog post, I outlined how the ODL file format is structured. A working version of an ODL parser was also created to read these files. One key detail was how personal file/folder, location or credential identifying strings were obfuscated with the original values stored in the ObfuscationStringMap.txt file. 

However some time in April 2022, Microsoft decided to change the way the obfuscation worked and the parser no longer worked (the unobfuscation part). 

What changed?

OneDrive now appeared to encrypt the data and the ObfuscationStringMap.txt is no longer used. The file may still exist on older installations, but newer ones include a different file.

Figure 1 - Contents of  \AppData\Local\Microsoft\OneDrive\logs\Business1 folder

As seen in Figure 1 above, there is a new file called general.keystore. This file's format is JSON that can be easily read and apparently holds the key to decrypt the encrypted content as a base64 encoded string. 

Figure 2 - Sample general.keystore contents


Time for some Reverse Engineering

With a little bit of digging around with IDA Pro on the LoggingPlatform.dll file from OneDrive, we can see the BCrypt Windows APIs being used in this file. Note, this is not the bcrypt hash algorithm which bears the same name!

Figure 3 - BCrypt* Imports in LoggingPlatform.dll

Jumping to where these functions are used, it is quickly apparent that the encryption used is AES in CBC (Cipher Block Chaining) mode with a key size of 128 bits. 


Figure 4 - IDA Pro Disassembly

In the above snippet, we can see the call to BCryptAlgorithmProvider and then if successful, a call to BCryptSetProperty function which has the following syntax:

NTSTATUS BCryptSetProperty(
  [in, out] BCRYPT_HANDLE hObject,
  [in]      LPCWSTR       pszProperty,
  [in]      PUCHAR        pbInput,
  [in]      ULONG         cbInput,
  [in]      ULONG         dwFlags
);

Without delving into too many boring assembly details, I'll skip to the relevant parts...

For each string to be encrypted, OneDrive initialises a new encryption object with the key that is stored in the general.keystore file, then encrypts the string and disposes of the encryption object. The encrypted blob is then base64 encoded and written out to the log the obfuscated string. There are a few other quirks along the way, such as replacement of the characters  / and  with _  and respectively, as the former can appear in base64 text but are also used in URLs to make it parseable later.


Why the change?

In the previous iteration of ODL (when the ObfuscationStringMap was used), there were instances where the same key (3 word combination) was often repeated in the file making it difficult or impossible to know which value to use as its replacement to get the original string.

Using encryption in place and not using a lookup table does appear to be a more robust scheme which eliminates the above issue. It does use some more disk space as the encrypted blob will always be a multiple of 16 bytes (128 bits) as this is block based encryption. In other words, it's inefficient for small text (less than 10 bytes). 


Updated code

The python ODL parser has been updated to accomodate this new format, and works with both the old and new versions. It is available here.

Sunday, February 13, 2022

Reading OneDrive Logs

Due to the popularity of OneDrive, it has become an important source of evidence in forensics. Last week, Brian Maloney posted about his research on reconstructing the folder tree from the usercid.dat files, and also provided a script to do so. In this brief post, we explore the format of OneDrive Logs, and provide a tool to parse them. In subsequent posts, I will showcase use case scenarios. 

Where to find them?

OneDrive logs have the extension .odl and are found in the user's profile folder at the following locations:

On Windows - 

C:\Users\<USER>\AppData\Local\Microsoft\OneDrive\logs\

On macOS - 

/Users/<USER>/Library/Logs/OneDrive/

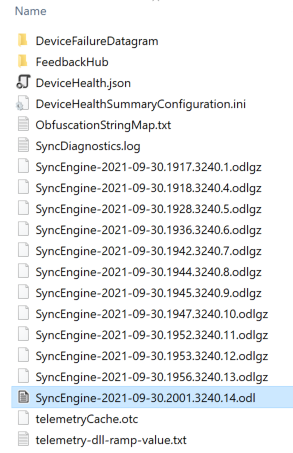
At these locations, there are usually 3 folders - Common, Business1 and Personal, each containing logs. As the name suggests Business1 is the OneDrive for Business version. 

Figure 1 - Contents of Business1 folder

The .odl file is the currently active log, while the .odlgz files are older logs that have been compressed. Depending on which folder (and OS) you are in, you may also see .odlsent and .aodl files, which have a similar format.

What is in there?

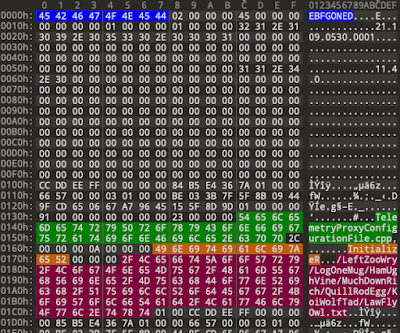
These are binary files, and cannot be directly viewed in a text editor. Here is what a .odl file looks like in a hex editor.

Figure 2 - .odl file in a hex editor

It is a typical binary file format with a 256 byte header and data blocks that follow. Upon first inspection, it seems to be a log of all important function calls made by the program. Having this low level run log can be useful in certain scenarios where you don't have other logging and need to prove upload/download or synchronisation of files/folders or even a discovery of items which no longer exist on disk/cloud. 

You do notice some funny looking strings (highlighted in red). More on that later.. 

The Format

With a bit of reverse engineering, the header format is worked out as follows:

struct {
    char     signature[8]; // EBFGONED
    uint32   unk_version;  // value seen = 2
    uint32   unknown2;
    uint64   unknown3;     // value seen = 0
    uint32   unknown4;     // value seen = 1
    char     one_drive_version[0x40];
    char     os_version[0x40];
    byte     reserved[0x64];
} Odl_header;

The structures for the data blocks are as follows:

struct {
    uint64     signature; // CCDDEEFF 0000000
    uint64     timestamp; // Unix Millisecond time
    uint32     unk1;
    uint32     unk2;
    byte       unk3_guid[16];
    uint32     unk4;
    uint32     unk5;  // mostly 1
    uint32     data_len;
    uint32     unk6;  // mostly 0
    byte       data[data_len];
} Data_block;

struct {
    uint32    code_file_name_len;
    char      code_file_name[code_file_name_len];
    uint32    unknown;
    uint32    code_function_name_len;
    char      code_function_name[code_function_name_len];
    byte      parameters[];
} Data;

In case of .odlgz files, the Odl_header is the same, followed by a single gzip compressed blob. The blob can be uncompressed to parse the Data_block structures.

Now, we can try to interpret the data. Leaving aside the few unknowns, the data block mainly consists of a timestamp (when event occurred), the function name that was called, the code file that function resides in and the parameters passed to the function. The parameters can be of various types like int, char, float, etc.. and that part hasn't been fully reverse engineered yet, but simply extracting the strings gives us a lot of good information. However the strings are obfuscated!

Un-obfuscating the strings

Since Microsoft uploads these logs to their servers for telemetry and debugging, they obfuscate anything that is part of a file/folder name or url string or username. However file extensions are not obfuscated. The ways this works is that the data identified to obfuscate is replaced by a word which is stored in a dictionary. The dictionary is available as the file ObfuscationStringMap.txt, usually in the same folder as the .odl files. To un-obfuscate, one simple needs to find and replace the strings with their original versions. 

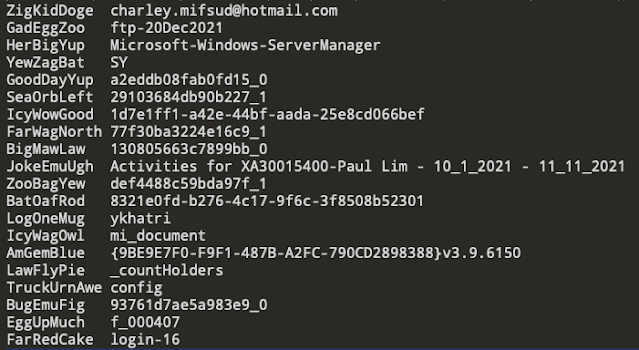
Figure 3 - Snipped of ObfuscationStringMap.txt

This is a tab separated file, stored as either UTF-8 or UTF-16LE depending on whether you are running macOS or Windows. 

Now, referring back to the original funny looking string in Figure 2 - 
/LeftZooWry/LogOneMug/HamUghVine/MuchDownRich/QuillRodEgg/KoiWolfTad/LawFlyOwl.txt
  .. after un-obfuscating becomes ..
/Users/ykhatri/Library/Logs/OneDrive/Business1/telemetry-dll-ramp-value.txt

It is important to note that since extensions are not obfuscated, they can still provide valuable intel even if some or all of the parts in the path cannot be decoded.

Now this process seems easy, however not all obfuscated strings are file/folder names or parts of paths/urls. Some are multi line strings. Another problem is that the words (or keys to the dictionary) are reused! So you might see the same key several times in the ObfuscationStringMap. The thing to remember is that new entries get added at the top in this file, not at the bottom, so when reading a file, the first occurrence of a key should be the latest one.  Also sometimes, the key is not found, as it's cleaned out after a period of time. Also there is no way to tell if an entry in the dictionary is stale or valid for a specific log file being parsed. All of this just means that the decoded strings need to be taken with a grain of salt. 

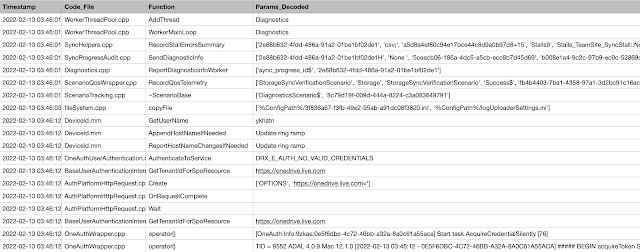
Based on the above, a python script to parse the ODL logs is available here. A snippet of the output produced by the script is shown below.

Figure 4 - output snippet


In a subsequent post, we'll go through the items of interest in these logs like Account linking/unlinking, uploads, downloads, file info, etc.. 

Saturday, January 9, 2021

Gboard has some interesting data..

Gboard - the Google Keyboard, is the default keyboard on Pixel devices, and overall has been installed over a billion times according to the Play Store.

Although not the default on most non-Google brands, it is a popular app installed by foreign language users because of its good support and convenience of use particularly with dozens of Asian and Indian languages.

As a keyboard app, it monitors and analyzes your keystrokes, offering suggestions and corrections for spelling and grammar, sentence completion and even emoji suggestions. 

Now for the interesting part. Since the last few versions, it also retains a lot of data (ie, user keystrokes!) in its cache. This is at least seen from the version from Jan 2020 (v 8.3.x). From a DFIR perspective, that is GOLD. For a forensic examiner, this can possibly show you data that was typed by the user on an app that is now deleted, or show messages typed that were then deleted, or messages from apps that have the disappearing message feature turned on! Or data entered into fields on web pages/online apps (that wouldn't be stored locally at all). Also for some apps that don't track when a particular item was created/modified, this could be useful.

Note - The Signal app wasn't specifically tested to see if data from that app is retained, but based on what we can see here, it seems likely those messages would end up here too. All testing was on a Pixel 3 running latest Android 11 using the default keyboard, and default settings. This was also verified on other earlier taken images. Josh Hickman's Android 10 Pixel 3 image was also used, and Josh was able to verify that Telegram and WhatsApp sent messages were present here. The specific versions of Gboard databases studied were:

  • 8.3.6.250752527 (on Android 10)
  • 8.8.10.277552084 (on Android 10)
  • 10.0.02.338070508 (on Android 11)

Location

Gboard's app data (sandbox) folder is located here:

/data/data/com.google.android.inputmethod.latin/databases/

Here you might see a number of databases that start with trainingcache*. These are the files that contain the caches.

Figure 1 - Contents of Gboard's databases folder (v 10.0.02.338070508)

In different versions of the app, the database formats and names have changed a bit. Of these, useful data can be found in trainingcache2.db, trainingcache3.db and trainingcachev2.db. Let's examine some of them now.

trainingcache2.db (v 10.0.02.338070508)

The table training_input_events_table contains information about the application in focus, its field name (where input was sent), the timestamp of event and a protobuf BLOB stored in _payload field, as shown in screenshot below.

Figure 2 - training_input_events_table (not all columns shown)

The highlighted entry above is from an app that was since deleted. The _payload BLOB is decoded in screenshot below, highlighting the text typed by the user in the Email input field. The protobuf has also has all of the data included in the other columns in the table.

Figure 3 - Decoded Protobuf from _payload column

In most instances however, the protobuf looks like this - see screenshot below, where input needs to be put back together as shown.. Here you can see the words the user typed as well as suggestions offered by the app. Suggestions can be for spelling, grammar, or contact names, or something else.
Figure 4 - Decoded protobuf - reconstructing user input

Above, you can see the words typed and suggestions offered. On an Android device, the suggestions appear as shown below while typing.

Figure 5 - Android keyboard highlighting suggested words

trainingcache3.db (v 10.0.02.338070508)

In version 8.x, this same database is named trainingcache2.db, and follows the same exact format. The table s_table looks similar to the training_input_events_table seen earlier. However, the _payload field does not store the keystokes here.

Figure 6 - s_table

Figure 7 - _payload protobuf decoded from s_table

Keystroke data is stored in the table tf_table. Here, most entries are a single key press, and to read this, it again needs to be put back together as shown below.

Figure 8 - tf_table entries

All keystrokes from the same session have the same f1 value (a timestamp like field but not used as a timestamp). The order of the keys pressed is stored in f4. Assuming they are all in order, we can run a short query to concatenate the f3 column values for easy reading (shown below). This isn't perfect, as group_concat() doesn't guarantee order of concatenation, but it seems to work for now!

Figure 9 - Reading keystroke sessions from tf_table

We can combine (join) this data with the one from s_table to recreate the same data as we got from training_input_events_table earlier. 

Figure 10 - joined tables

In the screenshot shown above, you can even see data being typed into a google doc, not saved locally. Only a snippet is shown above, but if you want to see the full parsed data, get Josh's Android image(s), and the latest version of ALEAPP (code), which now parses this out. Below is a preview (from a different image my students might recognize).

Figure 11 - ALEAPP output showing trainingcache parsed output


Cached keystroke data can also be seen and reconstructed from trainingcachev2.db, whose format is a bit different (not discussed here). Nothing of significance was found in trainingcache4 or the other databases. 

Observations

As expected, keystrokes from password fields are not stored or tracked.

In data reconstructed from tf_table, you can see all the spelling mistakes a user made while typing! Any corrections made in the middle of a word/sentence will be seen at the end (because we are getting the raw keystokes in order of keys pressed). Hence it might be difficult to read some input. Also, if a user types something into a field, then deletes a word(s), and retypes, you won't see the final edited (clean) version, as backspaces (delete) are not tracked. You can see some of this in the output above (figure 9).

The caches are periodically deleted (and likely size limited too), and so you shouldn't expect to find all user typed data here. 

Sunday, January 3, 2021

iOS Application Groups & Shared data

Background

Tracking down an iOS application's Data folder, aka, SandboxPath in iOS is fairly easy. One simply needs to look at the applicationState.db sqlite database located under /private/var/mobile/Library/FrontBoard/ This is well known. 

However locating the sandbox folder for its AppGroups (and Extensions) is not so straight-forward. The suggested method by Scott Vance here, and recommended by few others too is to look for the .com.apple.mobile_container_manager.metadata.plist file under each of the UUID folders:

  • /private/var/containers/Shared/SystemGroup/UUID/
  • /private/var/mobile/Containers/Shared/AppGroup/UUID/
  • /private/var/mobile/Containers/Data/InternalDaemon/UUID/
  • /private/var/mobile/Containers/Data/PluginKitPlugin/UUID/

As noted by Scott, the iLEAPP tool does this too, reading all the plists and listing out the path and its group name. For manual analysis, this works out great, as you can visually make out the app name from the group name. For example, the Notes app has bundle_id com.apple.mobilenotes and one of its shared groups (where the actual Notes db is stored!) has the id group.com.apple.notes.

The Problem

For automated analysis, this approach does not work, as each app follows its own convention on naming for ids. A program cannot know that group.com.apple.notes corresponds to com.apple.mobilenotes. Hence we search for something with a more direct reference connecting Shared Containers to their Apps. Before we proceed further, its important to understand the relationships between extensions, apps and shared containers. The diagram below does a good job of summarizing this. The shared containers are identified by AppGroups.

Figure 1 - iOS App, Extension, container relationships - Source:  https://medium.com/@manibatra23/sharing-data-using-core-data-ios-app-and-extension-fb0a176eaee9


The Solution

Fortunately, there is a database that tracks container information on iOS. It is located at /private/var/root/Library/MobileContainerManager/containers.sqlite3

It precisely lists all Apps, their extensions, AppGroups and Entitlements. As far as I can tell, this is the only place where this information is stored (apart from caches and logs). It does not have information about UUIDs. This database is listed in the SANS smartphone forensics poster, but I couldn't find any details on it elsewhere. 

The database structure is simple with just 3 main tables (and an sqlite_sequence one). 


Figure 2 - containers.sqlite database tables

The child_bundles table lists extensions and their owner Apps. In figure below, you can see the extensions for the com.apple.mobilenotes app.

Figure 3 - child_bundles table, filtered on 'notes'

Or one could write a small query to list all apps with their extension names like shown below.

Figure 4 - App & Extensions - query and output


Information about AppGroups is found in the data field of the code_signing_data table as a BLOB, which stores a binary plist.

Figure 5 - Plist (for com.apple.mobilenotes - cs_info_id 456) from 'code_signing_data.data'

The Entitlements dictionary has a lot of information in it. If this App creates a shared AppGroup, then it will show up under com.apple.security.application-groups. There may also be groups under com.apple.security.system-groups.

Figure 6 - AppGroup information in Entitlements section (in plist)

So from the above data, we know that the Notes App has 5 extensions and 2 AppGroups, and we have the exact string names(aka ids) too - group.com.apple.notes and group.com.apple.notes.import . Correlating this data with information we found from .com.apple.mobile_container_manager.metadata.plist files (from each UUID folder earlier), we can programmatically search and link the two as being part of the same App, based on the container id (AppGroup name).

Figure 7 - AppGroup/UUID folder showing plist's content and Container owner id

This methodology is implemented in the APPS plugin for ios_apt, which now lists every App, it's AppGroups, SystemGroups, Extensions, and all the relationships. So you don't have to do any of it manually now. Enjoy!


Figure 8 - Apps Table from ios_apt output (not all columns are shown here)

Figure 9 - AppGroupInfo Table from ios_apt output


Monday, December 28, 2020

Introducing ios_apt - iOS Artifact Parsing Tool

ios_apt is the new shiny companion to mac_apt

ios_apt is not a separate project, it's just a part of the mac_apt framework, and serves as a launch script that processes iOS/iPadOS artifacts. 

Why yet another iOS parsing tool, don't we already have too many?

In addition to paid tools, we have iLEAPP, APOLLO and a few others, and I am also an active contributor to some of them. This isn't meant to compete with them, rather it utilizes the mac_apt framework to prevent duplication of work. 

Many artifacts on iOS and macOS share common backend databases, configuration and artifact types. Among the artifacts that are almost identical are -

  • Spotlight
  • UnifiedLogging logs
  • Network usage database
  • Networking artifacts like hardware info and last IP leases
  • Safari
  • Notes
  • FSevents
  • ScreenTime

There are a few others too that aren't listed here. But you get the picture. Since mac_apt already parsed all of them, it made sense to just create an ios variant that parses these from ios extractions. 

Also many of these artifacts are fairly complex and other FOSS tools don't have the architecture needed to handle them. APOLLO only gathers information from SQLite databases. iLEAPP is geared towards single artifact parsing per plugin. It is not designed for multiple layers of parsing where information parsed from one artifact/file may be used as a key to jump to an artifact elsewhere on disk.

Limitations

In its first version, ios_apt only works on full file system images extracted out to a folder. No support yet for zip/tar/dar/7z/other archives.

Available Plugins / Modules

The following Plugins are available as of now -

  • APPS
  • BASICINFO
  • FSEVENTS
  • NETUSAGE
  • NETWORKING
  • NOTES
  • SAFARI
  • SCREENTIME
  • SPOTLIGHT
  • TERMSESSIONS
  • WIFI
Download the latest version of mac_apt to get ios_apt.

Sunday, July 19, 2020

KTX to PNG in Python for iOS snapshots

App snapshots on iOS are stored as KTX files, this is fairly well known at this point, thanks to the research by Geraldine Blay (@i_am_the_gia) and Alex Brignoni (@AlexisBrignoni) here and here. They even came up with a way to collect and convert them to PNG format. However that solution was only for macOS, and hence this research..

KTX

KTX is a file format used to store textures, and used commonly by OpenGL programs. The KTX file format is known and available here. There aren't many standalone utilities that work with KTX files, as it is mostly used in games and not for reading/distributing standalone textures. There are also no readily available python libraries to read it! The Khronos group that created the format distributes libktx, but it is C++ only. Even so, it would not be able to read iOS created ktx files (read on for the reasons mentioned below). The few Windows applications I could find like PicoPixel would not recognize Apple created KTX files as valid files.

So what is different here? A quick glance over the file in the hex editor showed that the texture data was stored in LZFSE compressed form, which currently only macOS/iOS can read.

Figure - Ascii view of 010 hex editor with ktx template

Now using pyliblzfse, I could decompress the data, and recreate a new KTX file with raw texture data. Even so, it would not render with KTX viewers other than macOS's Finder/Quickview and Preview. So I tried a few different approaches to get to the data.

Attempt 1 - Rendering & Export

Textures are different from 2D images and there is hence not a direct conversion from a textures to an image format. From available research, it seemed like the easiest way to do this would be to use OpenGL to render the texture data (extracted from the KTX file), then use OpenGL to save a 2D image of the rendered image. There is some sample code available too on the internet, but in order to get it to work, one would need to know how to use OpenGL to render textures, a learning curve that was too steep for me..

After spending several hours trying to get this to work in Python, I ultimately gave up as python is not the platform where major OpenGL development takes place, therefore there is little to no support, and libraries are platform dependent. I barely got one of the libraries to install correctly in Linux, and every step of the way I got more errors than I wanted to debug, ultimately I threw in the towel.

Attempt 2 - Convert texture data to RAW image data

Reading the KTX file header, the glInternalFormat value field from the header is 0x93B0 for all iOS produced KTX files (as seen in screenshot above). This value is the enumeration for COMPRESSED_RGBA_ASTC_4x4. So now we know the format is ASTC, which is Adaptive Scalable Texture Compression, a lossy compressed format for storing texture data, and uses a block size of 4x4 pixels. That simplifies our task to now finding a way to convert ASTC data to raw image data. A bit of searching led me to the python library astc_decomp which does precisely that. So what I needed now was to put the pieces together as follows:

  1. Read KTX file and parse format to get LZFSE compressed data, and parameters of Width and Height
  2. Decompress LZFSE to get ASTC data
  3. Convert ASTC to RAW image stream
  4. Save RAW image as PNG using PIL library

Combining this together, we are able to create a python script that can convert KTX files to PNG files. Get it here:
https://github.com/ydkhatri/MacForensics/tree/master/IOS_KTX_TO_PNG

There is also a windows compiled executable there if you need to do this on windows without python. Alex Brignoni was helpful in sending me samples of KTX files to work with from multiple images. The code also works with KTX files that are not really KTX, ie, they have the .ktx extension but the header is 'AAPL'. The format is however similar and my code will parse them out too. If you do come across a file that does not work, send it to me and I can take a look.

A point to note is that not all KTX files use the COMPRESSED_RGBA_ASTC_4x4 format, only the iOS created ones do. So you may come across many KTX files deployed or shipped with apps that can't be parsed with this tool, as it only handles ASTC 4x4 format.

Enjoy!

Tuesday, June 9, 2020

Screentime Notifications in Catalina (10.15)

If you routinely perform mac forensics, you've probably done a few macOS Catalina (10.15) examinations already. And if you are the kind that verifies your data, you may have noticed that for ScreenTime notifications the databases don't show you the same strings that you see in the actual displayed Notification and several forensic tools don't either.


Let's explore why.

To start with, lets review the format of the Notifications database. For macOS High Sierra (10.) and above, it is located at:

/private/var/folders/<xx>/<yyyyyyy>/0/com.apple.notificationcenter/db2/db

where the <xx>/<yyyyyy> portion represents what might appear like random strings, but they are not random. This folder path represents the DARWIN_USER_DIR for a specific user. For more details on this read my old post here.

Inside the database, the record table holds the actual notification data (title, sub-title, body) and date of notification among other fields. A simple database query can get the useful data.

SELECT 
  (SELECT identifier FROM app WHERE app.app_id=record.app_id) as app,
  uuid, data, presented, delivered_date
FROM record

The actual notification data is within a plist stored in the column data. Inside this plist, you can easily navigate to the items titl, subt and body to get the title, sub-title and body. However for screentime notifications, the data looks different. Instead of individual strings in these values, they are lists.

Figure 2 - Embedded plist for screentime notification
Screentime uses format strings and a list of data, which needs to be put back together. This is similar to how Event logs in windows or Unified logging in macOS works. The format strings are located at the paths shown below (for english) and are available in other languages too:

/System/Library/UserNotifications/Bundles/com.apple.ScreenTimeNotifications.bundle/Contents/Resources/en.lproj/Localizable.strings
/System/Library/UserNotifications/Bundles/com.apple.ScreenTimeNotifications.bundle/Contents/Resources/en.lproj/InfoPlist.strings

These files are plists which consist of a single dictionary each. So WeeklyReportNotificationNegativeDeltaBody seen in plist above resolves to the message :
"Your screen time was down %@ last week, for an average of %@ a day." The %@ will be replaced with data provided (15% and 6 hours, 24 minutes) becoming:
"Your screen time was down 15% last week, for an average of 6 hours, 24 minutes a day."

Figure 3 - Snippet of Localizable.strings plist
Similarly WeeklyReportNotificationTitle becomes Weekly Report Available. So now, we are able to reconstruct the complete original message.

mac_apt's NOTIFICATIONS plugin has now been updated with this functionality.